MySQL Performance Tuning: The Task Everyone Avoids
MySQL performance tuning is one of those tasks every hosting admin knows they should do — and most never get around to. The default configuration ships optimized for a 512MB server from 2008. Your production server has 16GB RAM and NVMe storage, but MySQL is still running with innodb_buffer_pool_size = 128M.
The traditional workflow looks like this: download mysqltuner.pl, run it over SSH, scroll through 200+ lines of output, translate the recommendations into my.cnf changes, restart MySQL, and hope nothing breaks. If something does break — and it can — you manually revert the changes and start over.
A wrong innodb_buffer_pool_size value can push your server into swap, slowing every site to a crawl. A misconfigured max_connections triggers the dreaded "Too many connections" error and takes down your entire customer base. The risk keeps most admins on default settings, leaving 60-70% of their server's performance potential untouched.
This is why Panelica ships a built-in MySQL Tuner with a performance score, smart recommendations, one-click apply, automatic backup, and a built-in benchmark engine. No SSH required.
The Traditional Way: Manual MySQL Tuning
What MySQL Tuning Looks Like on Every Other Panel
On most servers — whether running cPanel, Plesk, HestiaCP, or no panel at all — the process is the same:
Step 1: SSH into your server
ssh root@your-serverStep 2: Download and run mysqltuner.pl
wget https://raw.githubusercontent.com/major/MySQLTuner-perl/master/mysqltuner.pl
chmod +x mysqltuner.pl
perl mysqltuner.pl --host localhost --user root --pass YOUR_PASSWORD
Step 3: Read and interpret 200+ lines of output
[--] Data in InnoDB tables: 2.4G (Tables: 145)
[!!] InnoDB buffer pool / data size: 128.0M / 2.4G
[!!] Ratio InnoDB log file size / InnoDB Buffer pool size (75%): 96.0M / 128.0M should be ~25%
[OK] ThreadPool enabled
[!!] Maximum reached memory usage: 856.7M (55.12% of installed RAM)
[!!] Maximum possible memory usage: 1.2G (75.01% of installed RAM)
[!!] Slow queries: 12% (1.2K/10K)
[--] Reads / Writes: 82% / 18%
[--] Binary logging is disabled
[!!] InnoDB buffer pool instances: 1 -- RAM > 1G and pool_instances < 2
[OK] No tables are opened outside of InnoDB or MyISAM
Variables to adjust:
 innodb_buffer_pool_size (>= 1.2G) if possible.
 innodb_buffer_pool_instances (>= 2)
 innodb_log_file_size should be (=512M)
 max_connections: 151 (used 21 of 151 max connections: 13%)
 thread_cache_size: current value: 9 (set to 32 for multi-core)
Step 4: Manually edit my.cnf
nano /etc/mysql/mysql.conf.d/mysqld.cnf
# OR
nano /etc/my.cnf

# Add or change these lines:
innodb_buffer_pool_size = 1G
max_connections = 200
innodb_io_capacity = 2000
tmp_table_size = 64M
thread_cache_size = 32
Step 5: Restart MySQL — and hope it comes back up
systemctl restart mysql
# Watch the logs and pray...
Step 6: If something breaks...
# MySQL won't start?
journalctl -u mysql -n 50
# Find the wrong setting, revert it manually, restart again
# Hope you remember what you changed...
Problems with this approach:
- Requires SSH root access every time
- mysqltuner.pl output is highly technical — many admins can't interpret it correctly
- Calculating optimal values (based on RAM, disk type, workload) requires deep expertise
- A wrong setting can crash MySQL and take down every site on the server
- No backup mechanism — you manually track what you changed
- No rollback — if MySQL won't start, you're reverting by hand under pressure
- No benchmark — you changed the settings, but did performance actually improve?
- You must repeat the entire process every time you want to check the status
What Other Panels Offer
my.cnf directly. Third-party MySQL tuner extensions exist in the Plesk marketplace, but they are paid add-ons.
Panelica MySQL Tuner: The Complete Solution
How to Access
URL: /databases/mysql-tuner — Available to ROOT and ADMIN users.
The MySQL Tuner is organized into three tabs: Overview, Configuration, and Benchmark. Each one handles a distinct part of the tuning workflow.
Tab 1: Overview — Performance Dashboard
Performance Score
The first thing you see is a gauge showing your MySQL performance score from 0 to 100. The color tells you where you stand at a glance:
- Excellent (90–100) — MySQL is well-tuned for your hardware
- Good (70–89) — Minor improvements available
- Fair (50–69) — Significant gains possible
- Poor (0–49) — Default or misconfigured settings, immediate attention needed
Most servers running with default MySQL settings score between 30 and 45.
Server Information Cards
These eight cards give Panelica the context it needs to generate accurate recommendations. The disk type detection, for example, directly determines whether to recommend innodb_io_capacity = 200 (HDD) or innodb_io_capacity = 4000 (NVMe). The server RAM drives the innodb_buffer_pool_size calculation. The peak connection count informs the max_connections recommendation.
Smart Recommendations Table
Below the server cards is a table of specific recommendations. Each row includes:
- A severity badge: Critical (red), Warning (yellow), Info (blue), or OK (green)
- The variable name in code format
- A plain-English description of what the setting does and why it matters
- The current value (highlighted in red if suboptimal)
- The recommended value (highlighted in green)
- An impact badge: High, Medium, or Low
The "Apply All Recommended" button at the top applies every Critical and Warning recommendation in one action. Before applying, Panelica shows a confirmation dialog explaining that MySQL will restart (approximately 5 seconds). It automatically backs up the current my.cnf. If MySQL fails to start after the change, it automatically restores the backup.
Tab 2: Configuration — Granular Control
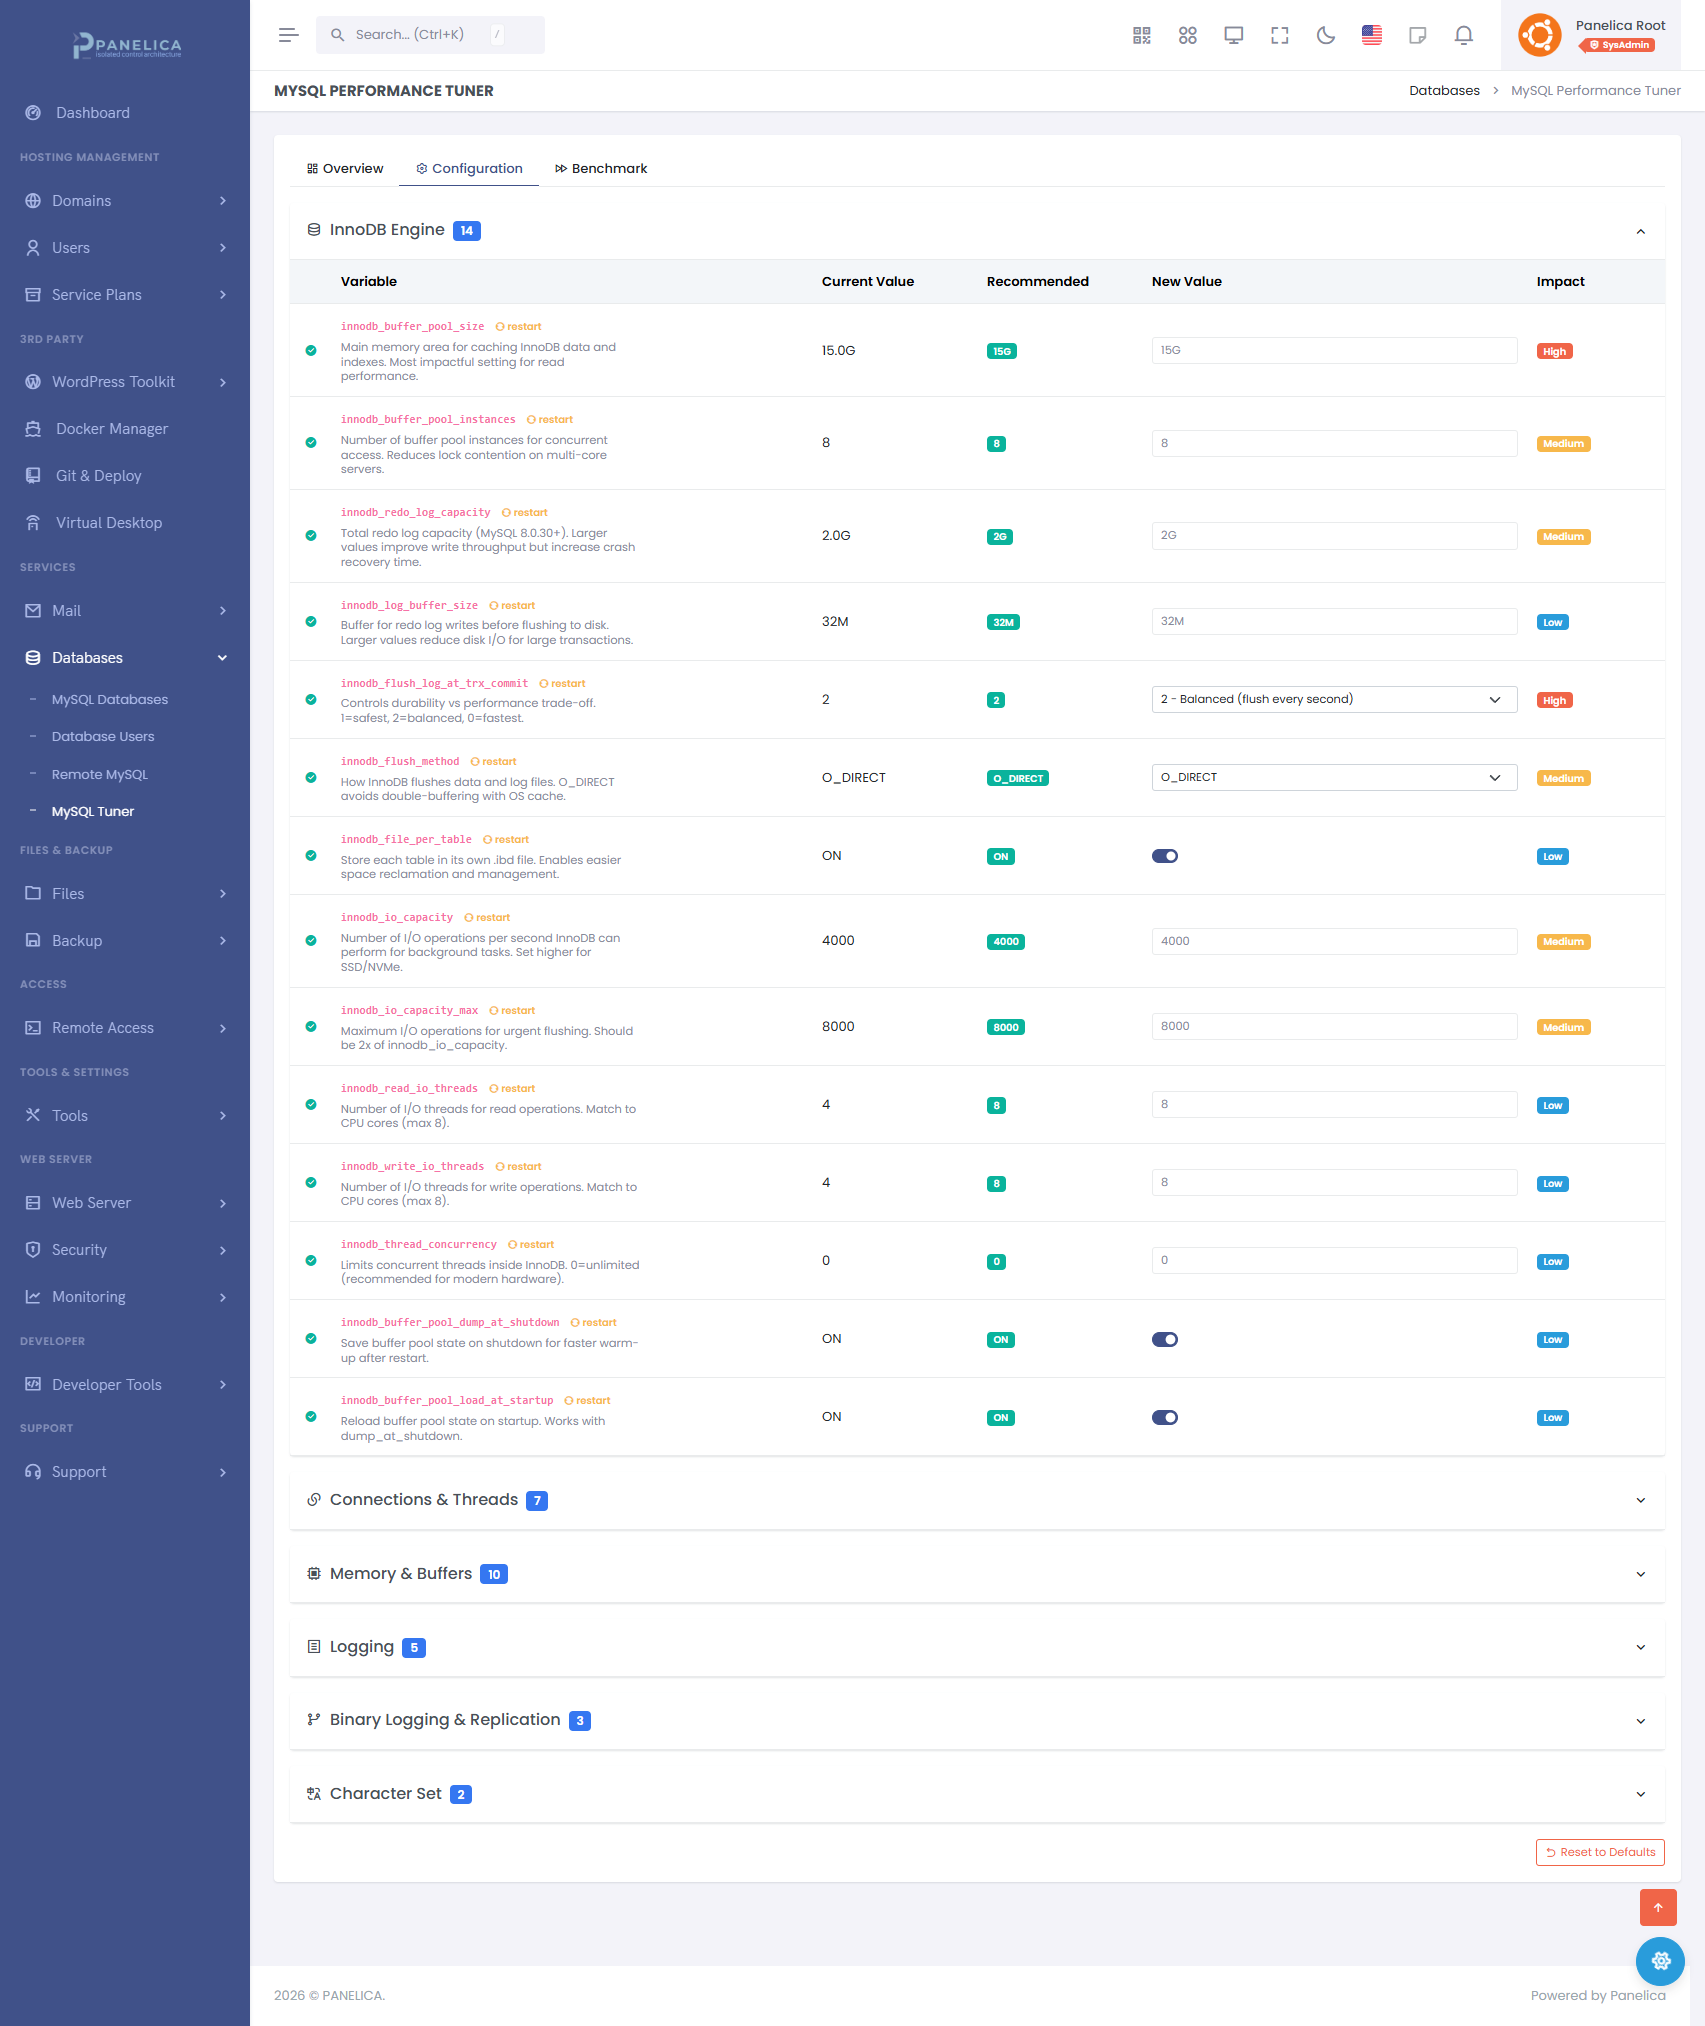
Panelica MySQL Tuner — Configuration tab with InnoDB Engine settings, real-time recommendations, and one-click apply
The Configuration tab gives you full control over individual MySQL settings, organized into six logical groups. You don't need to know the variable name — every setting has a label, a description, and the current vs. recommended value displayed side by side.
① InnoDB Engine — The Most Important Group
InnoDB settings have the largest impact on MySQL performance for typical web workloads. The key variables:
innodb_buffer_pool_size— The single most important MySQL setting. This is the main memory area where InnoDB caches table data and indexes. Recommended: 50–70% of total server RAM. On an 8GB server, set this to 4–5GB. Default is 128MB — which is why most servers score poorly.innodb_io_capacity— The number of I/O operations per second MySQL can perform. For SSD/NVMe: 2000–8000. For traditional HDD: 200. Setting this too low throttles MySQL's background work.innodb_io_capacity_max— The burst I/O capacity ceiling. Typically 2x the base value.innodb_buffer_pool_instances— Splits the buffer pool into parallel segments. Recommended: 1 per GB of buffer pool, up to 8.innodb_log_file_size— Transaction log size. Larger logs mean less frequent checkpoints and better write performance.innodb_flush_log_at_trx_commit— The durability vs. speed tradeoff. Value1(default) is safest. Value2gives a performance boost with minimal risk. Value0is fastest but risks data loss on crash.innodb_flush_method— How MySQL writes to disk.O_DIRECTbypasses OS cache (recommended when innodb_buffer_pool_size is large).
② Connections and Threads
max_connections— Maximum simultaneous client connections. Too low: "Too many connections" errors. Too high: excessive RAM consumption (each connection reserves memory). Panelica calculates the recommended value based on your peak connection history and available RAM.thread_cache_size— Caches idle threads to avoid the overhead of creating new ones on every connection. Recommended: 32–64 on multi-core servers.wait_timeout/interactive_timeout— How long to keep idle connections open. Reducing these frees connections faster on busy servers.
③ Memory and Buffers
tmp_table_size/max_heap_table_size— Maximum size for in-memory temporary tables. If exceeded, MySQL writes to disk (much slower). For WordPress and CMS workloads, 64–128MB is recommended.join_buffer_size— Buffer for JOIN operations on tables without indexes.sort_buffer_size— Buffer for ORDER BY sorting. Allocates per connection, so keep it reasonable (1–4MB).read_buffer_size— Buffer for sequential table scans.
④ Slow Query Logging
slow_query_log— Enable/disable slow query logging via a simple toggle. Indispensable for identifying which queries are causing performance problems.long_query_time— Log queries taking longer than this many seconds. Start with 1.0 second, lower to 0.5 once the obvious problems are fixed.general_log— Logs every query. Use only for debugging — it generates enormous log files on production.
⑤ Binary Logging
binlog_expire_logs_seconds— How long to retain binary logs. Lower this on servers without replication to reclaim disk space.
⑥ Character Set
character_set_server/collation_server— Default character set and collation for new databases.utf8mb4withutf8mb4_unicode_ciis the correct default for all modern web applications.
Applying Changes
When you change any value, a yellow alert bar appears at the top of the page with "Discard" and "Apply and Restart MySQL" buttons. Clicking apply triggers an automatic my.cnf backup, applies the changes, and restarts MySQL. Total downtime: approximately 5 seconds. If MySQL fails to start, the backup is automatically restored and you see an error with the MySQL log output explaining what went wrong.
Tab 3: Benchmark — Measure, Don't Guess
You changed the settings. But did performance actually improve? Without a benchmark, you're guessing. On most panels, running a MySQL benchmark means installing sysbench over SSH, configuring a test database, running the test, parsing the output, and cleaning up. In Panelica, it's one button.
How the Benchmark Works
Panelica's built-in benchmark creates a temporary test database, runs 1,000 INSERT operations followed by 200 SELECT operations, measures the results, then drops the test database. The full test completes in 10–30 seconds depending on server load.
Results are presented in four summary cards:
The full results table shows duration, read/write operation counts, QPS, average latency, P95 latency, maximum latency, buffer pool hit rate (with a progress bar), and error count.
Benchmark history keeps your last 10 test results, so you can run a test before tuning, apply recommendations, run the test again, and see the exact improvement side by side.
Real-World Example: Tuning a WordPress Hosting Server
Scenario
- 50 WordPress sites on a single VPS
- 8 GB RAM, 4 CPU cores, NVMe SSD
- MySQL running with default configuration
- Intermittent "Too many connections" errors, slow admin panels
Step 1: Open MySQL Tuner — Performance Score: 35/100 (Poor)
The Overview tab immediately shows 4 Critical and 3 Warning recommendations.
Step 2: Review Recommendations
| Variable | Severity | Current | Recommended |
|---|---|---|---|
| innodb_buffer_pool_size | Critical | 128 MB | 4 GB |
| innodb_io_capacity | Critical | 200 | 4000 (NVMe detected) |
| max_connections | Warning | 151 | 300 |
| tmp_table_size | Warning | 16 MB | 128 MB |
| thread_cache_size | Warning | 9 | 32 |
Step 3: Click "Apply All Recommended"
Confirmation dialog → Apply → MySQL restarts in 5 seconds → All settings applied. Automatic backup taken.
Step 4: Run Benchmark — Before vs. After
| Metric | Before | After | Change |
|---|---|---|---|
| Queries/Second | 45 QPS | 187 QPS | +315% |
| Avg Latency | 22.0 ms | 5.3 ms | -76% |
| Buffer Pool Hit Rate | 61% | 97% | +36pp |
Step 5: Performance Score
35/100 (Poor) → 92/100 (Excellent)
Total time: 2 minutes. No SSH. No googling "recommended innodb_buffer_pool_size for 8GB RAM". No risk of breaking anything.
Feature Comparison
| Feature | Manual SSH | cPanel/WHM | Plesk | HestiaCP | Panelica |
|---|---|---|---|---|---|
| Performance Score (0–100) | |||||
| Smart Recommendations | mysqltuner.pl (CLI) | (paid ext.) | Built-in | ||
| One-Click Apply All | |||||
| Automatic my.cnf Backup | |||||
| Automatic Rollback on Failure | |||||
| Built-in Benchmark Engine | sysbench (manual) | ||||
| Benchmark History (last 10) | |||||
| Plain-English Variable Descriptions | Partial | 80+ descriptions | |||
| Grouped Settings (6 categories) | Partial | ||||
| No SSH Required | Limited | Fully browser-based |
Frequently Asked Questions
Stop Guessing. Start Measuring.
MySQL Tuner is one of 20 managed services built into every Panelica installation.
Stop googling "recommended innodb_buffer_pool_size for 8GB RAM." Stop editing my.cnf over SSH and hoping MySQL starts back up. Panelica analyzes, recommends, applies, benchmarks, and rolls back — all from your browser.
If you found this guide useful, these posts go deeper on related topics:
- How Panelica Isolates Every User: 5-Layer PHP Security Architecture Explained
- Best Open Source Server Panel 2026: Full Comparison
- MySQL Database Management: phpMyAdmin SSO, Automated Backups, Remote Access
Thinking about switching from legacy panels?
See how Panelica compares feature-by-feature, including real 2026 pricing and migration steps.
See the full comparison