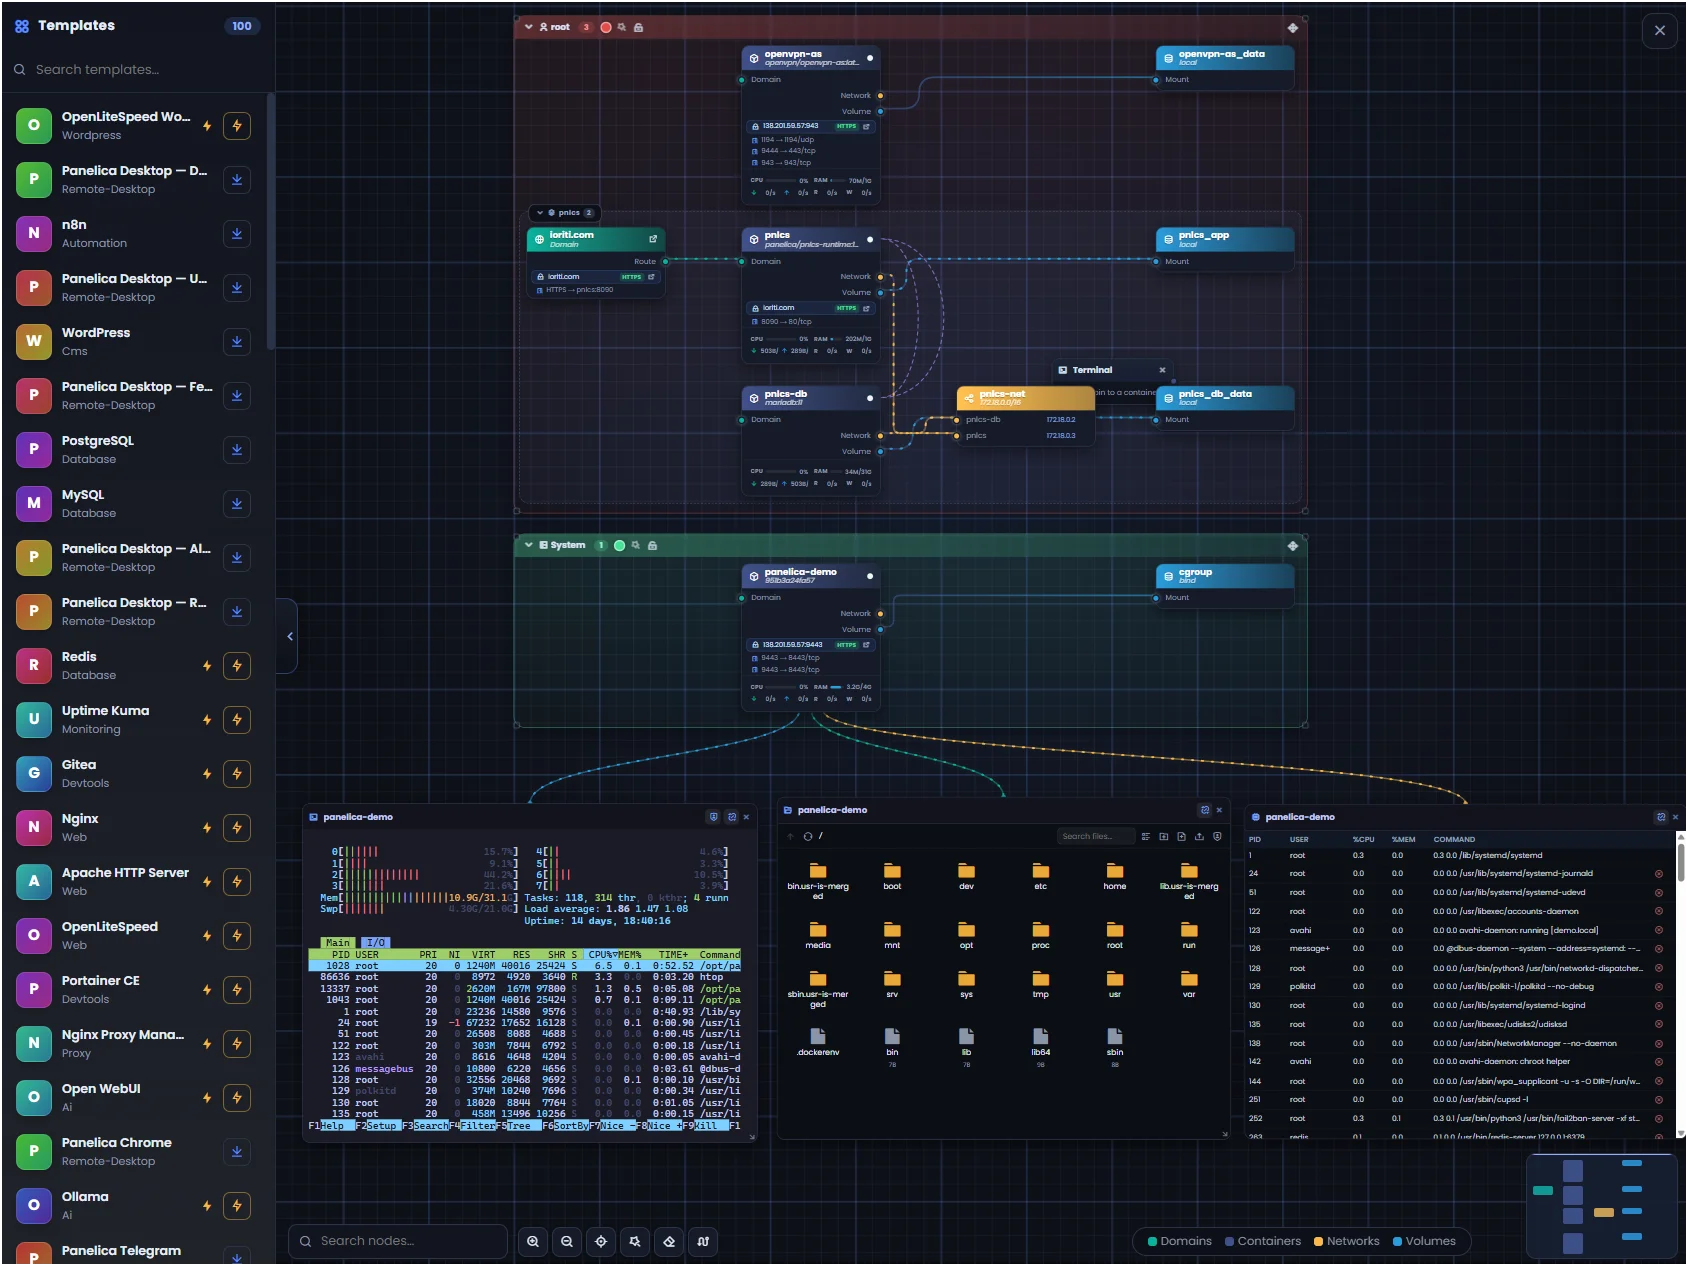
Docker is not hard because containers are hard. It is hard because a running stack lives in a dozen places at once — docker ps here, a compose file there, a network you defined last month, a volume you are afraid to delete. Panelica does not change what Docker can do. It changes how you see and operate it: one command center where every container, network, volume and domain is visible, wired, and one right-click away from any action.
One command center for your whole Docker host
The Docker Manager opens on a single dashboard that answers the questions you actually have: what is running, what needs attention, how much disk am I using, and what is each container doing right now. Engine version, Compose version and storage driver sit in the header; live CPU and memory stream on every row.
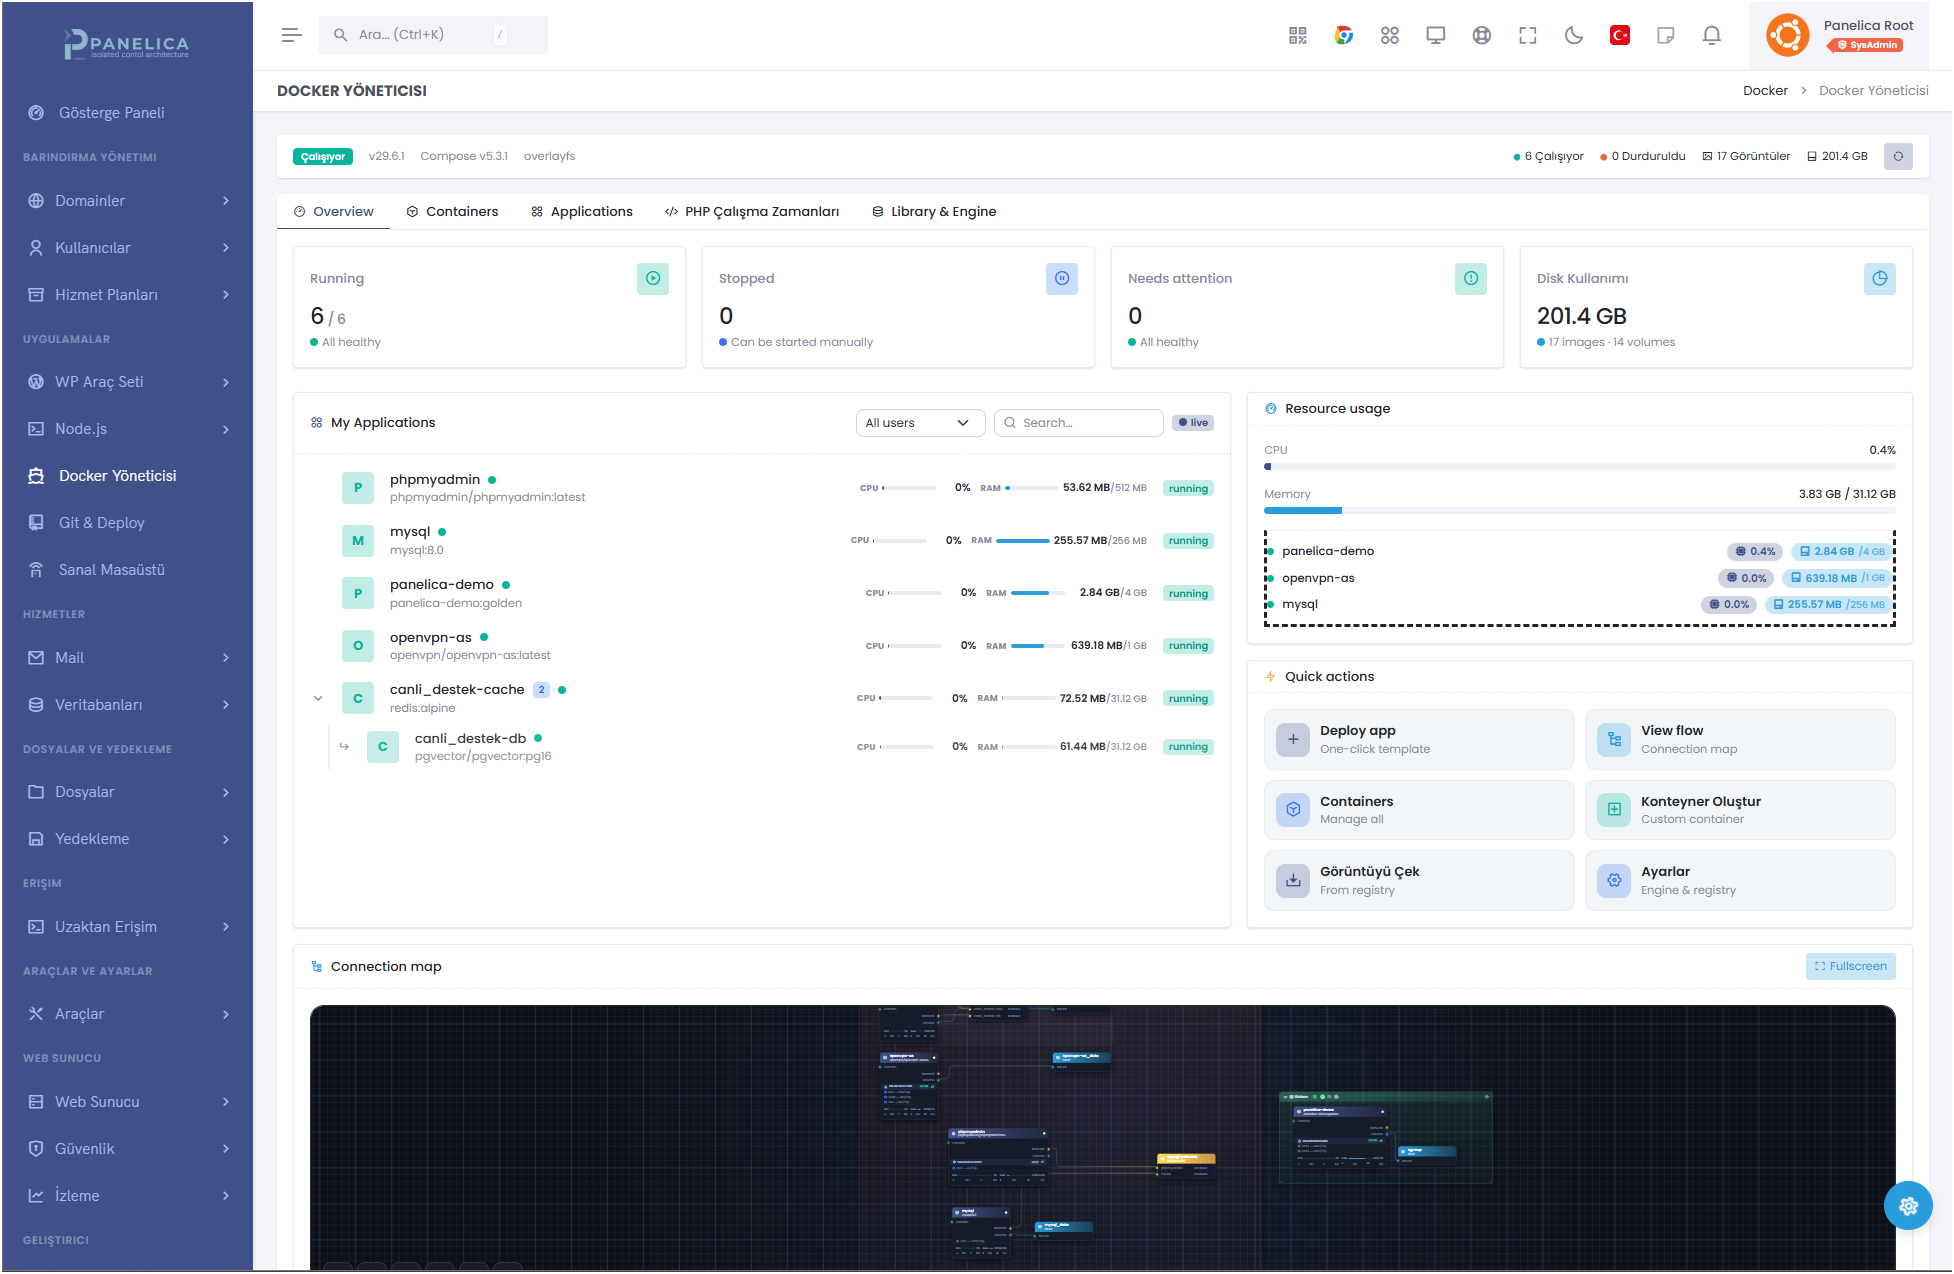
Five tabs organise everything without burying it:
- Overview — health cards, live applications, resource usage, quick actions.
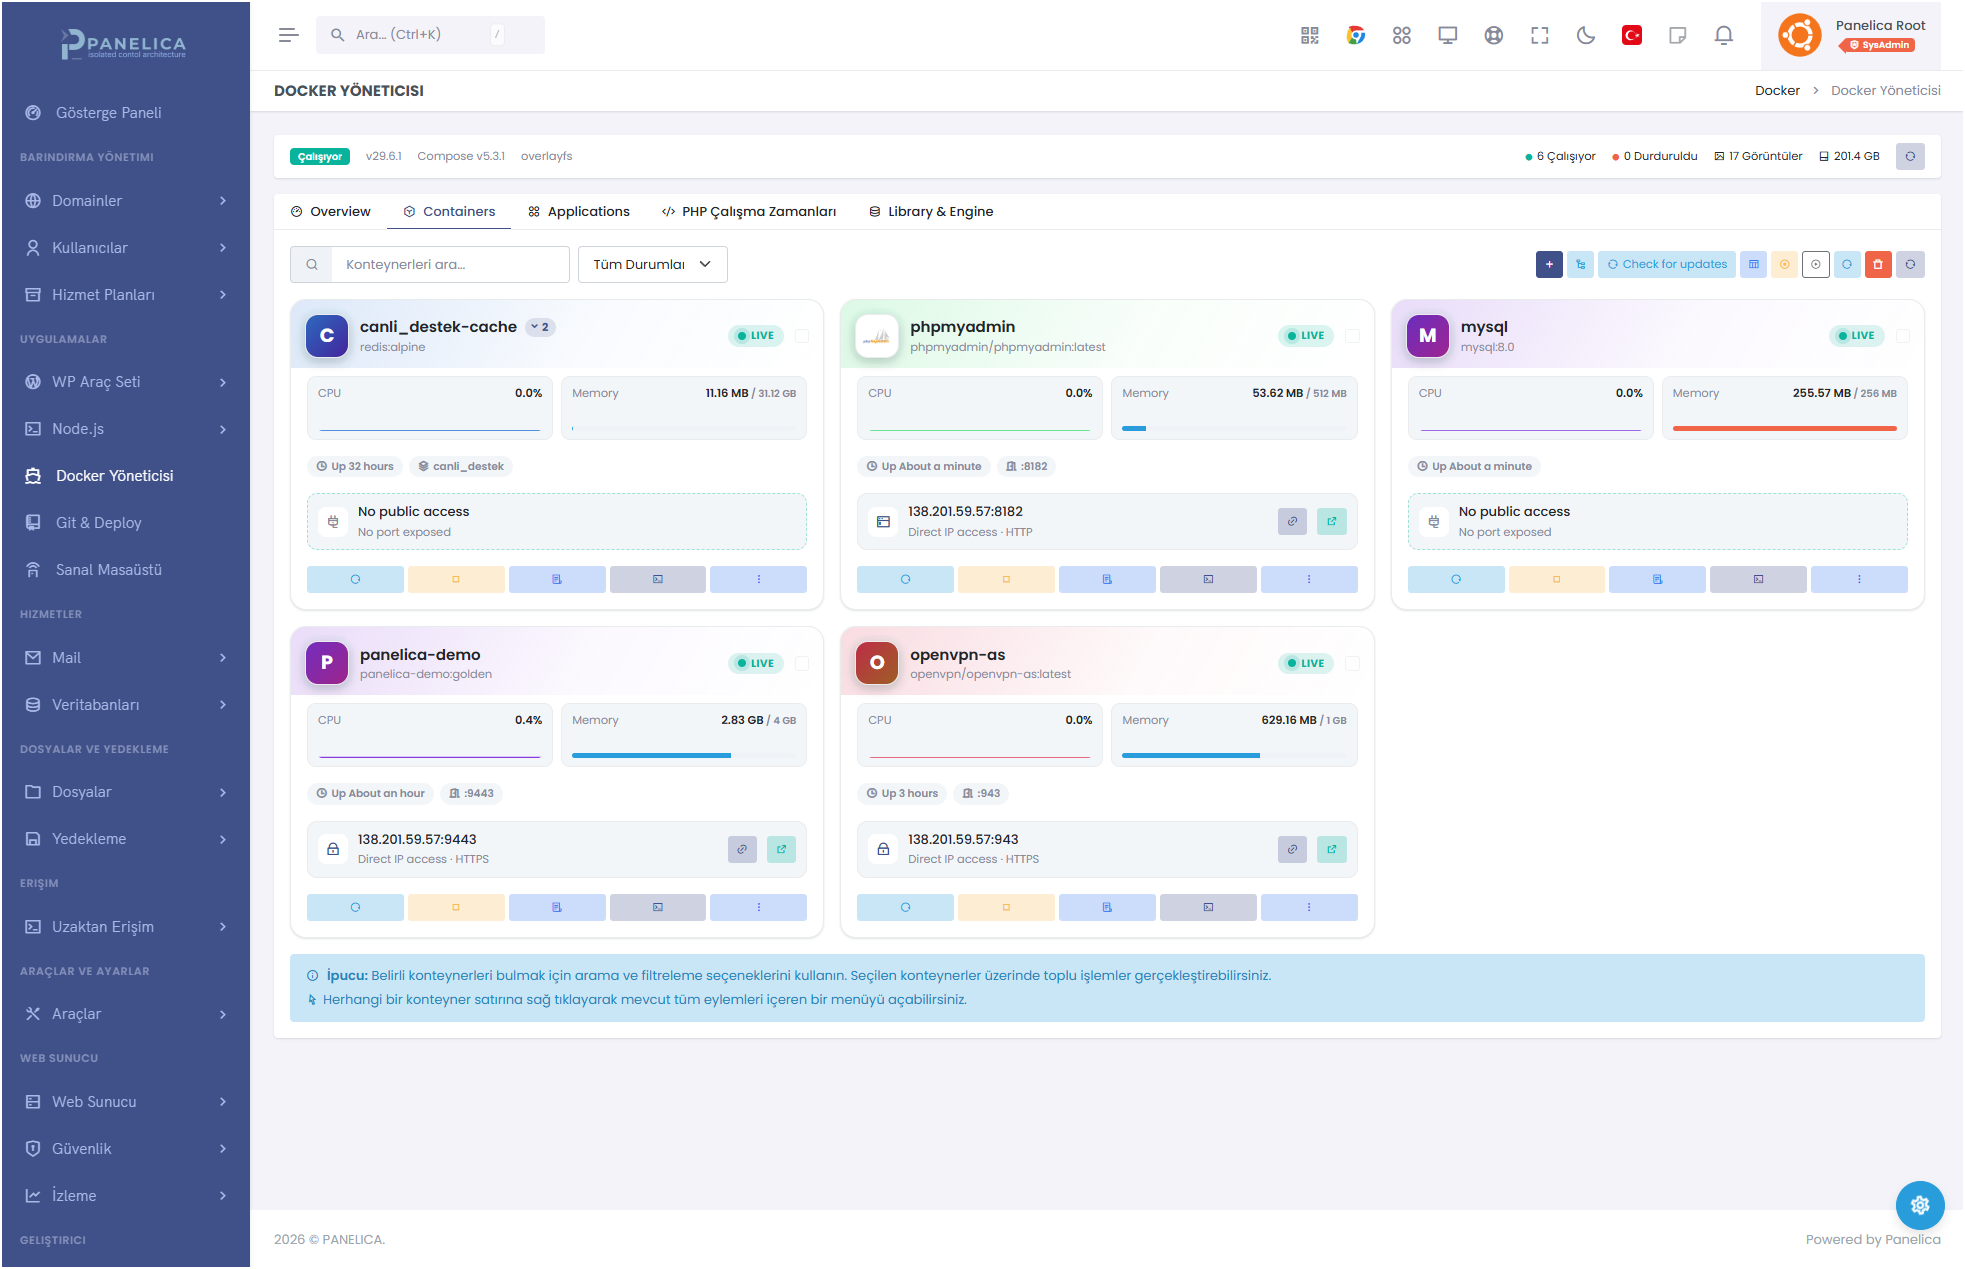
- Containers — every container as a live card or row, with inline actions.
- Applications — stack-aware grouping (a WordPress + database + cache stack reads as one app, not three loose containers).
- PHP Runtimes — managed PHP-FPM images for legacy and modern apps.
- Library & Engine — images, volumes, networks and engine/registry settings.
Every container at a glance
The Containers tab renders each container as a card: live CPU and memory bars, uptime, the image and tag, and — the detail most panels miss — how to reach it. Panelica auto-detects the access scheme from the container port, so an app serving TLS shows an HTTPS badge with a click-to-open link, while a database that exposes no public port is clearly marked No public access. No guessing which port maps where.
Right-click for anything
This is where day-to-day work happens. Right-click any container — in the card grid, the table, or the visual flow — and the same complete menu appears, grouped so the action you want is where you expect it. No hunting through tabs, no memorising flags.
The Visual Flow: your whole stack as one living map
Click View flow and the panel reads the live state of the Docker engine and lays it out as an interactive, blueprint-style graph. Containers are grouped into owner lanes; domains route in from the left; networks and volumes wire out to the right. Colour encodes type, wires are the real relationships, and a live footer shows CPU and RAM on every container node.
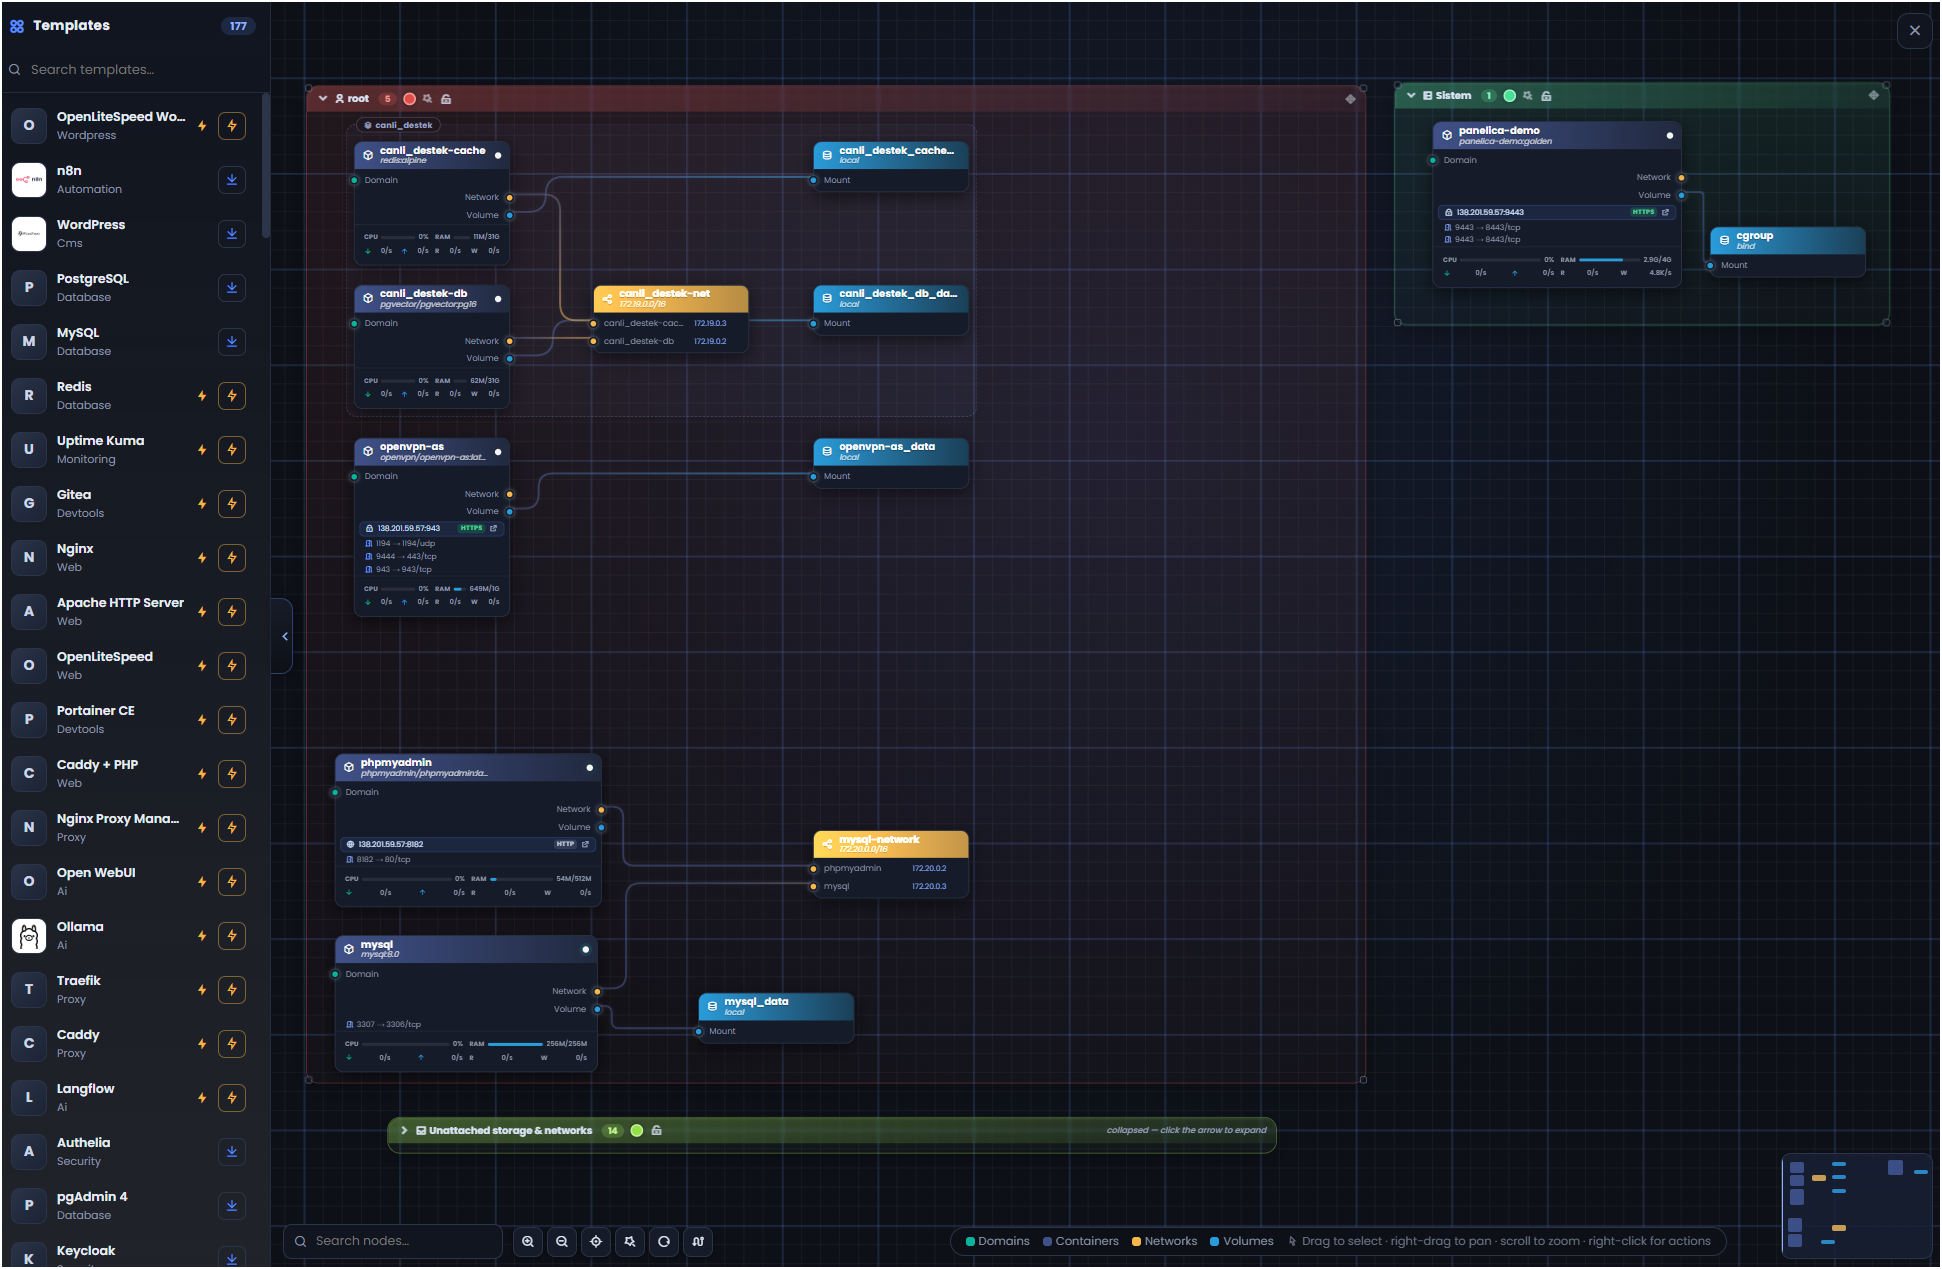
Every node has labelled pins: a domain pin on the left, network and volume pins on the right. Drag a wire from a container’s network pin to a network node and Panelica runs the real docker network connect — there is no separate form. The same is true for attaching a volume or routing a domain. What you draw is what the engine does.
The flagship flow: put a container behind a domain, safely
The single most useful thing an operator does is give a container a real domain with working TLS. On the command line that means editing an nginx server block, hoping the syntax is right, reloading, and praying you did not just take down the other sites on the box. In Panelica it is one wire — and behind that wire is a transactional, self-rolling-back pipeline. If any step fails, the previous configuration is restored automatically. You cannot half-break a domain.
Updating a container without fear
New image tags ship constantly. Panelica makes updating a two-click, reversible operation instead of a hand-typed pull + stop + rm + run dance that risks losing your configuration.
- Check for updates — the Containers toolbar scans your running images against their registries and flags the ones with a newer tag available.
- Update image — right-click the container and choose Update image. A dialog shows the current image and lets you enter the new tag.
- Recreate, preserving everything — Panelica pulls the new image and recreates the container with the same environment variables, mounts, networks, ports and labels. Your data volumes are untouched; only the image layer changes.
Because the recreate carries the full configuration forward, updating a database or an app container does not mean re-wiring it afterwards. The domain still routes, the volumes still mount, the networks still connect.
Three things you can do in minutes
1. Deploy a full app stack from a template
Open the template library (99 apps: WordPress, n8n, Gitea, Uptime Kuma, PostgreSQL, Redis, Ollama, Open WebUI, Nextcloud-class tools and more). Pick WordPress; Panelica provisions the app container plus its database and cache as a single, stack-aware application. In the Applications tab they appear grouped under one name, and in the Visual Flow they share a lane, already wired to their private network and data volumes.
2. Put a self-hosted tool behind your domain with HTTPS
Deploy n8n (or any container). In the Visual Flow, drag a wire from a domain node to the container — or right-click and choose Link domain. The nine-step pipeline backs up the current config, detects that n8n speaks HTTP on its port, generates the reverse-proxy config, tests it, reloads nginx, health-checks the backend, and saves the mapping. Seconds later https://automation.yourdomain.com serves n8n, with TLS handled for you and automatic rollback if anything had gone wrong.
3. Upgrade a container to a new version, reversibly
Run Check for updates; a container flags a newer tag. Right-click, then Update image, confirm the tag, and Panelica recreates it on the new image while carrying every environment variable, mount and network binding forward. If the new version misbehaves, the previous image is still in your library to recreate from — and your data volume never moved.
What runs where
The canvas is a thin, honest view. Every action it offers maps to a real backend operation — there is no privileged state hiding in the browser. Your click becomes a Docker Engine API call or a config-generation pipeline on the server, executed under Panelica’s role-based access model.
FAQ
Does Panelica replace Docker or the Docker CLI?
No. Panelica drives the same Docker Engine you already use. Everything on the canvas is a real Docker operation; the CLI keeps working exactly as before.
What is the Visual Docker Flow?
An interactive, blueprint-style canvas that shows your live Docker topology — domains, containers, networks and volumes — as connected nodes you can wire and manage directly.
How do I connect a container to a domain?
Drag a wire from the container to the domain, or right-click and choose Link domain. Panelica runs a nine-step transaction (back up config, detect HTTP/HTTPS, generate and syntax-test the reverse-proxy config, reload nginx, health-check, save) and rolls back automatically if any step fails.
How does updating a container work?
Run Check for updates to flag newer image tags, then right-click, then Update image. Panelica pulls the new image and recreates the container with the same environment, mounts, networks and ports. Data volumes are untouched.
What can I do from the right-click menu?
Open the app, terminal (or root shell), file manager, start/stop/pause/restart, view logs, link or unlink a domain, inspect, rename, edit environment variables, set CPU/RAM limits, define a healthcheck, manage mounts, export a compose file, update the image, clone, or delete — all in one place.
Is it safe to manage production Docker this way?
Config changes are backup-first and reload-last with automatic rollback, and every action is authorised server-side under Panelica’s role-based access model. A failed change restores the previous working state instead of leaving a broken one.
Can I still use compose files?
Yes. Panelica manages compose projects directly, can export any container as a docker-compose.yml, and visualises the resulting topology on the same canvas.
The takeaway
Containers gave us portable infrastructure. What they did not give us was a way to see and operate it without living in a terminal. Panelica keeps every ounce of Docker’s power and adds the missing layer: a single, living picture of your system, every container one right-click from any action, and safety rails — backup-first config, automatic rollback, config-preserving updates — so routine work stops being risky. It does not change what Docker can do. It changes how you manage it.