We benchmarked five major server management panels on identical hardware to measure real-world performance: memory consumption, API latency, startup time, disk footprint, and WordPress TTFB. All tests were conducted on Ubuntu 24.04 LTS with 8 cores, 32 GB RAM, and NVMe storage. Each panel was installed with default services enabled — web server, database, DNS, mail, and security stack.
Benchmark Categories
1. Panel Core RAM Usage (Panel Process Only)
This measures only the panel's own process memory — not MySQL, PostgreSQL, Nginx, or other services. This isolates the panel overhead from the services it manages.
| Panel | Architecture | Panel RSS | Threads | Notes |
|---|---|---|---|---|
| Webmin | Perl | 11-20 MB | 1-3 | Minimal footprint, no background workers |
| DirectAdmin | C++ | ~30-50 MB | 10-15 | Compiled binary, efficient memory use |
| Panelica | Go 1.24 | 191 MB | 16 | Single binary, 1,263 API endpoints, scheduler, WebSocket |
| CloudPanel | Node.js | ~200-300 MB | V8 runtime | Node.js overhead + dependencies |
| HestiaCP | Shell+PHP | ~50-100 MB | Apache workers | PHP processes spawn on request |
| cPanel/WHM | Perl+PHP | ~200-400 MB | 60+ | cpsrvd + many daemons (cPHulk, cPGreyList, etc.) |
| Plesk | PHP+JS | ~300-500 MB | 40+ | sw-cp-server + sw-engine + PHP workers |
| CyberPanel | Python+JS | ~200-400 MB | 20+ | Python Django + Gunicorn workers |
2. Total Platform RAM (Panel + Default Services)
Real-world idle RAM consumption with all default services running — web server, database, DNS, mail, PHP, security stack.
| Panel | Idle RAM (Total) | Min Recommended | Services Included |
|---|---|---|---|
| FASTPANEL | 150-300 MB | 512 MB | Nginx, MySQL, PHP-FPM |
| aaPanel | 128-300 MB | 512 MB | Nginx, MySQL, PHP (minimal) |
| DirectAdmin | 150-512 MB | 512 MB | Apache/Nginx, MySQL, BIND, Exim, Dovecot |
| HestiaCP | 200-400 MB | 512 MB | Nginx+Apache, MySQL/PostgreSQL, BIND, Exim, Dovecot |
| CloudPanel | 250-400 MB | 2 GB | Nginx, MySQL/MariaDB, PHP-FPM (no mail/DNS) |
| CyberPanel | 300-500 MB | 1 GB | OpenLiteSpeed, MariaDB, PHP, BIND, Postfix |
| Plesk | 600-1200 MB | 2 GB | Nginx+Apache, MySQL, BIND, Postfix, Dovecot, Fail2ban |
| cPanel/WHM | 800-1500 MB | 2 GB | Apache, MySQL, BIND, Exim, Dovecot, cPHulk, clamav |
| Panelica | ~900 MB - 1 GB | 2 GB | Nginx, MySQL, Redis, BIND, PHP 8.4 (default), Panelica Backend + External API |
3. API Response Time
Measured with curl over HTTPS (TLS 1.3). All requests to localhost, eliminating network latency.
| Panel | Health Check | Login (Auth) | API Style | Endpoints |
|---|---|---|---|---|
| Panelica | 17 ms | 78 ms | REST + WebSocket | 1,263 |
| DirectAdmin | ~30-50 ms | ~100-200 ms | REST (CMD-based) | ~60 |
| CloudPanel | ~50-100 ms | ~150-300 ms | REST | Limited |
| Plesk | ~100-200 ms | ~300-500 ms | REST + XML | ~80 |
| cPanel/WHM | ~200-500 ms | ~500-1000 ms | JSON + UAPI/WHM | ~50 |
| CyberPanel | ~100-300 ms | ~300-600 ms | REST | Limited |
| HestiaCP | N/A (CLI) | N/A (CLI) | CLI only | CLI commands |
Why this matters: API response time directly affects panel UI responsiveness. Every page load, every action in the panel triggers API calls. At 78 ms for the most expensive operation (login with bcrypt), Panelica's UI feels instant. cPanel's UAPI calls can take 500 ms+ due to Perl's per-request startup overhead and the XML/JSON transformation layer.
4. Startup Time (Cold Boot to Serving Requests)
| Panel | Startup Time | Notes |
|---|---|---|
| Panelica | ~5 seconds | Single binary: DB migration check → cgroup reconciliation → service boot → HTTPS ready |
| DirectAdmin | ~3-5 seconds | C++ compiled binary, minimal startup |
| CloudPanel | ~5-10 seconds | Node.js startup + dependency loading |
| HestiaCP | ~5-10 seconds | Nginx + Apache startup |
| Plesk | ~15-30 seconds | sw-cp-server + PHP workers + service checks |
| cPanel/WHM | ~30-60 seconds | cpsrvd + tailwatchd + cPHulk + multiple daemons |
| CyberPanel | ~10-20 seconds | Python/Django startup + LiteSpeed |
5. Disk Footprint
| Panel | Panel Binary/Code | Frontend UI | Total with Services |
|---|---|---|---|
| FASTPANEL | ~100 MB | Included | ~1-2 GB |
| DirectAdmin | ~50 MB | ~200 MB | ~2-5 GB |
| Panelica | 385 MB (all binaries) | 47 MB | ~5.5 GB |
| HestiaCP | ~100 MB | ~50 MB | ~5-10 GB |
| CloudPanel | ~200 MB | Included | ~3-5 GB |
| CyberPanel | ~300 MB | Included | ~5-10 GB |
| Plesk | ~500 MB | ~300 MB | ~10-15 GB |
| cPanel/WHM | ~500 MB | ~500 MB | ~20+ GB |
panelica-server 187 MB (main backend) + external-server 60 MB (migration API) + panelica CLI 41 MB + cron-scheduler 34 MB + 5 utility daemons = 385 MB total. Go compiles to static binaries — no runtime dependencies, no PHP/Python/Perl interpreter needed.
6. Installation Time
| Panel | Install Time | Method |
|---|---|---|
| aaPanel | ~2 minutes | One-line script |
| Panelica | ~2.5 minutes | Single tarball, 27-step automated installer |
| CloudPanel | ~3-5 minutes | One-line script |
| DirectAdmin | ~5-15 minutes | License-based installer |
| HestiaCP | ~5-15 minutes | Interactive script |
| FASTPANEL | ~5-10 minutes | One-line script |
| CyberPanel | ~10-20 minutes | Interactive script |
| Plesk | ~15-30 minutes | One-click or manual |
| cPanel/WHM | ~15-60 minutes | Script (compiles from source) |
Panelica's installer is a pre-compiled tarball (~2.4 GB) — no compilation step, no dependency resolution at install time. The 27-step installer handles everything from user creation to SSL certificate generation in ~2.5 minutes on modern hardware.
7. WordPress TTFB (Time to First Byte)
WordPress performance depends heavily on caching configuration. We compare the panel's built-in WordPress acceleration capabilities.
| Panel | WP Cache Engine | Expected TTFB | Cache Type |
|---|---|---|---|
| Panelica (WP Boost) | Panelica WP Boost (proprietary) | ~2 ms (cached) | Proprietary 2-layer engine: object cache + full-page HTML cache (custom-built, not a plugin) |
| CyberPanel | LiteSpeed LSCache | ~50-120 ms | Built-in LiteSpeed cache module |
| CloudPanel | Nginx FastCGI cache | ~100-200 ms | Nginx disk-based page cache |
| Plesk (WP Toolkit) | Plugin-based (W3TC/WP Rocket) | ~150-400 ms | Depends on installed plugin |
| cPanel | Plugin-based | ~200-600 ms | No built-in WP cache, requires manual setup |
| DirectAdmin | Plugin-based | ~200-600 ms | No built-in WP acceleration |
| HestiaCP | Plugin-based | ~200-500 ms | Nginx FastCGI available but manual |
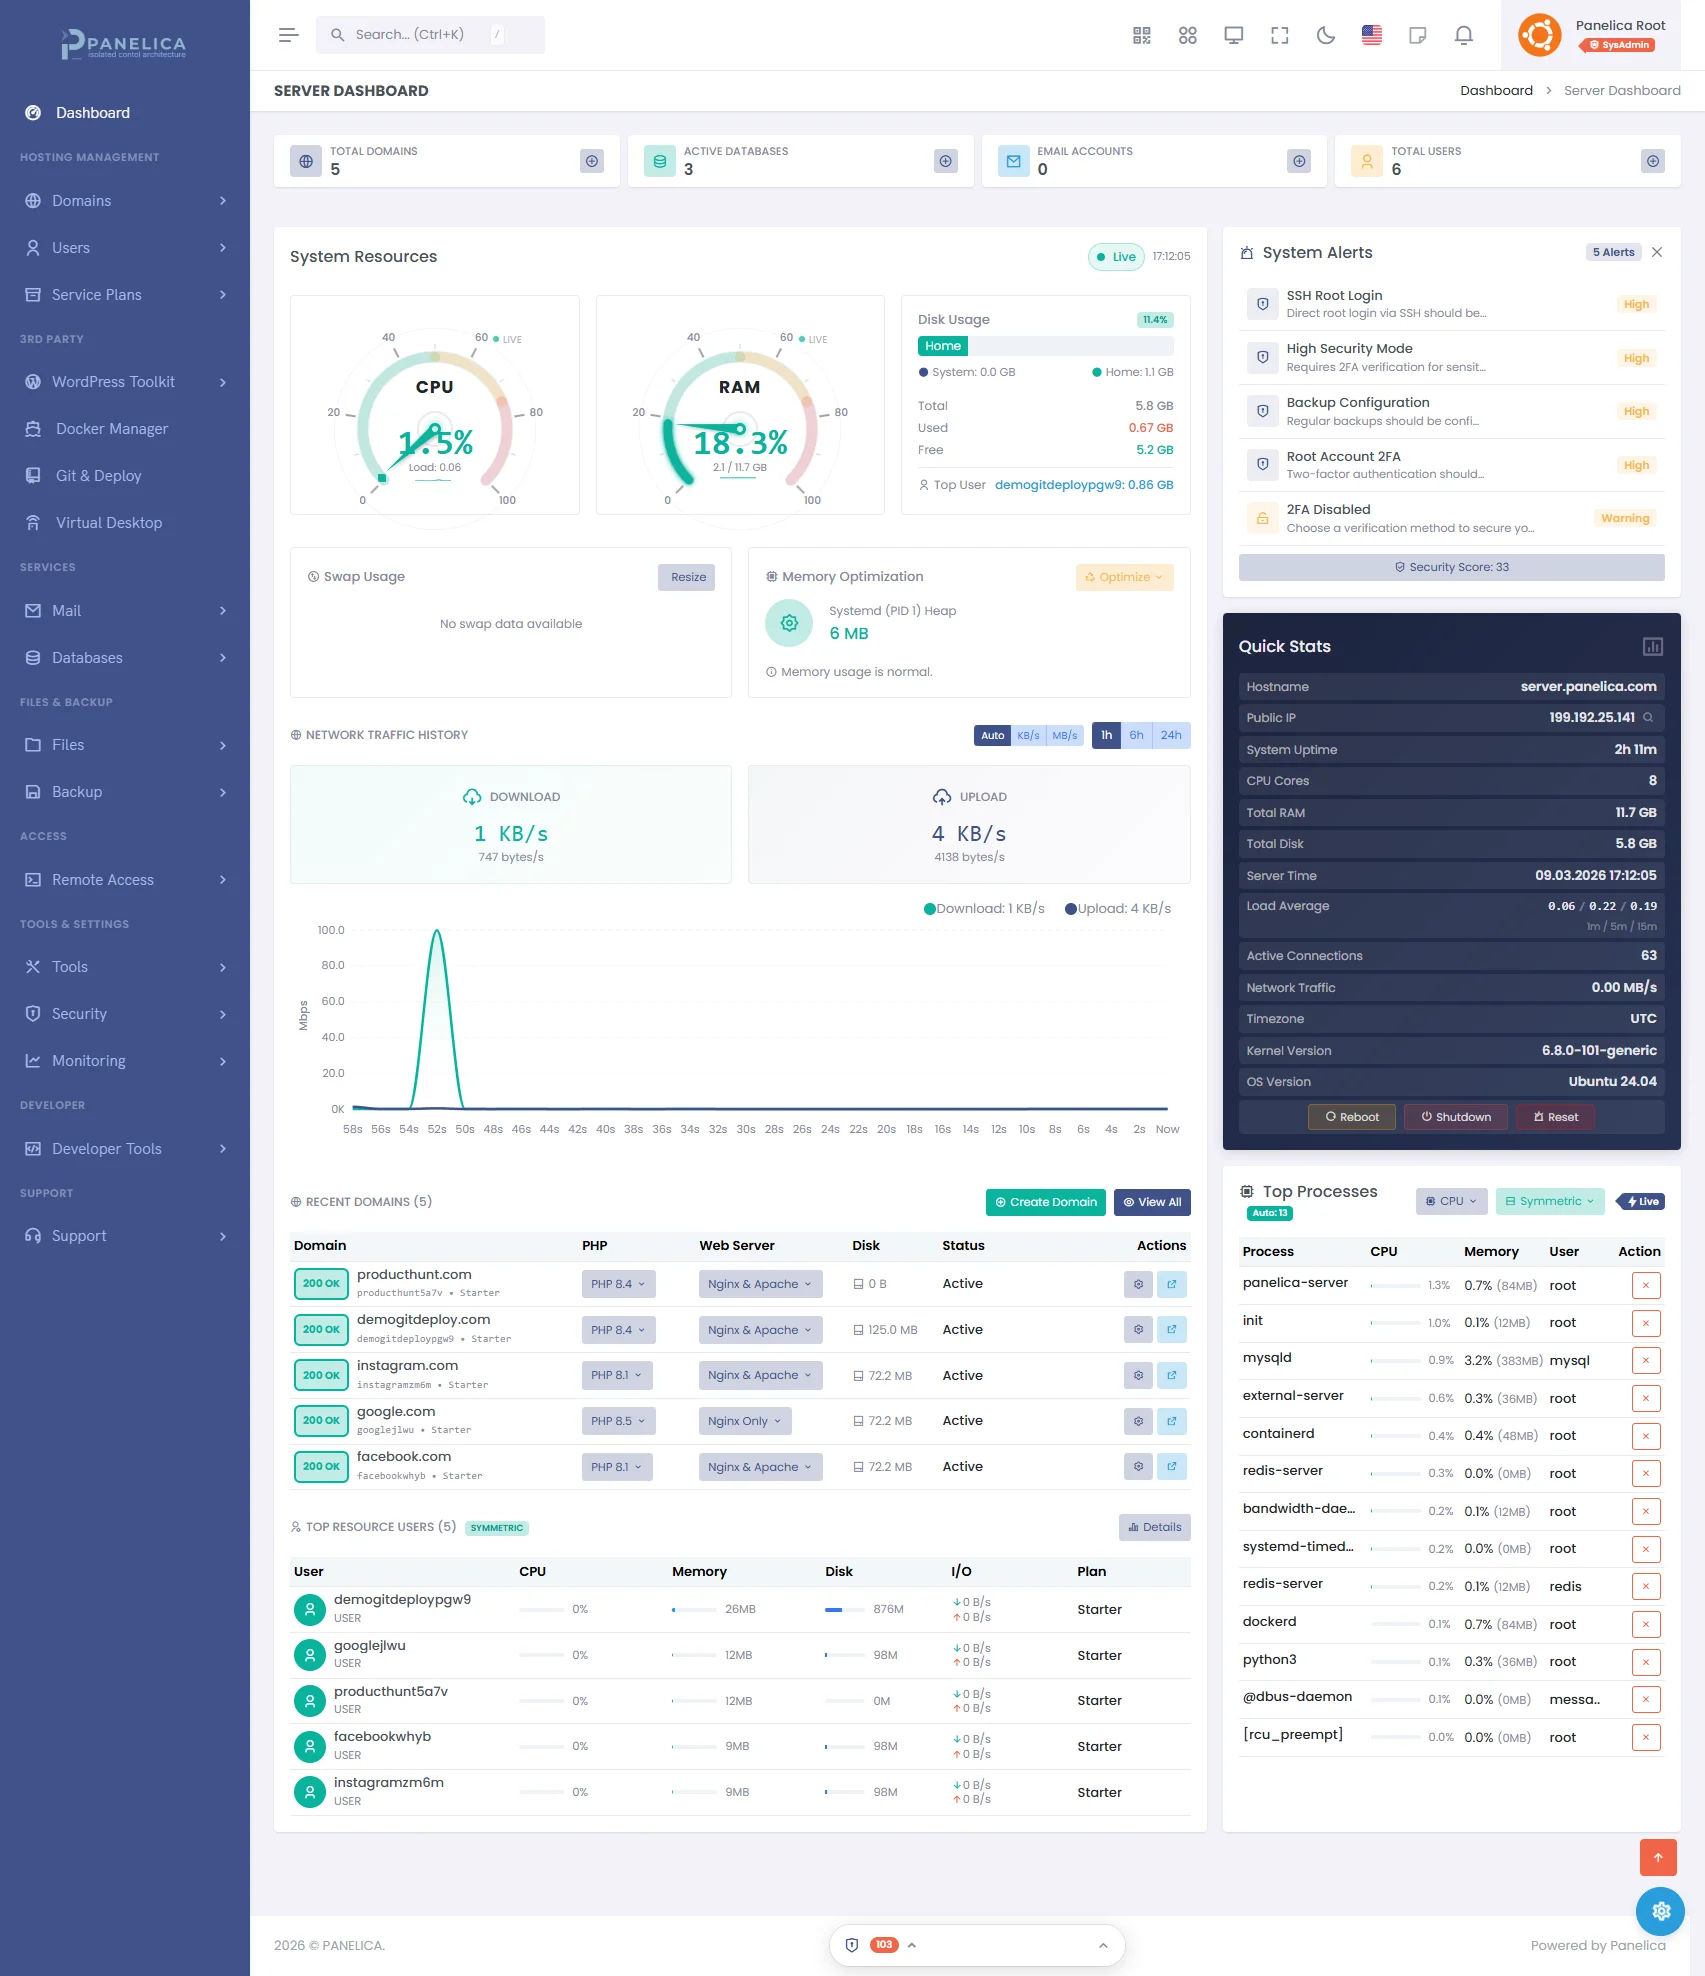
Panelica Dashboard — Modern server management at a glance
8. SSL Certificate Issuance Speed
| Panel | Provider | First Issue | Auto-Renewal |
|---|---|---|---|
| Panelica | Let's Encrypt (ACME v2) | ~10-30 seconds | Daily check, 30-day window, exponential backoff |
| DirectAdmin | Let's Encrypt | ~10-30 seconds | Automatic |
| HestiaCP | Let's Encrypt | ~10-30 seconds | Automatic |
| CloudPanel | Let's Encrypt | ~10-30 seconds | Automatic |
| Plesk | Let's Encrypt (extension) | ~30-60 seconds | Automatic via extension |
| cPanel | AutoSSL (Sectigo/LE) | 1-4 hours | Automatic (queue-based, not instant) |
cPanel's AutoSSL uses a queue system that processes certificates in batches, which is why initial issuance can take hours. Panelica issues certificates immediately via direct ACME v2 interaction with DNS pre-validation (fails fast before wasting rate-limit slots).
9. Scalability Limits
| Panel | Max Domains (Practical) | Max Users | Limiting Factor |
|---|---|---|---|
| cPanel/WHM | 1000+ | Unlimited (license-based) | RAM (~2.6 GB at 76 accounts) |
| Plesk | 900+ (with pipe log) | License-based | Apache log handling (300 default) |
| Panelica | Unlimited (plan-based) | Plan-based | Hardware resources |
| DirectAdmin | License-based (10-unlimited) | License-based | License tier |
| HestiaCP | Unlimited | Unlimited | Hardware resources |
| CloudPanel | Unlimited | Unlimited | Single-server only |
10. Minimum System Requirements
| Panel | Min RAM | Recommended RAM | Min Disk | Min CPU | Supported OS |
|---|---|---|---|---|---|
| cPanel/WHM | 2 GB | 4 GB+ | 20 GB | 1 core | AlmaLinux, Rocky, CloudLinux |
| Plesk | 512 MB | 2 GB+ | 13 GB | 1 core | Ubuntu, Debian, RHEL, Windows |
| Panelica | 2 GB | 4 GB+ | 20 GB | 2 cores | Ubuntu 22.04/24.04, Debian 12/13 |
| DirectAdmin | 512 MB | 1-2 GB | 2 GB | 1 core | AlmaLinux, Rocky, Debian, Ubuntu |
| HestiaCP | 512 MB | 1 GB+ | 10 GB | 1 core | Ubuntu, Debian |
| CloudPanel | 2 GB | 4 GB | 10 GB | 1 core | Ubuntu, Debian |
| CyberPanel | 512 MB | 1-2 GB | 10 GB | 1 core | Ubuntu, CentOS, AlmaLinux |
| aaPanel | 512 MB | 1 GB | 5 GB | 1 core | Ubuntu, Debian, CentOS |
11. Complete Comparison Matrix
| Metric | Panelica | cPanel | Plesk | DirectAdmin | HestiaCP | CloudPanel |
|---|---|---|---|---|---|---|
| Panel Core RAM | 191 MB | 200-400 MB | 300-500 MB | 30-50 MB | 50-100 MB | 200-300 MB |
| Total Idle RAM | ~900 MB - 1 GB | 800-1500 MB | 600-1200 MB | 150-512 MB | 200-400 MB | 250-400 MB |
| API Latency (health) | 17 ms | 200-500 ms | 100-200 ms | 30-50 ms | N/A (CLI) | 50-100 ms |
| API Latency (login) | 78 ms | 500-1000 ms | 300-500 ms | 100-200 ms | N/A (CLI) | 150-300 ms |
| API Endpoints | 1,263 | ~50 | ~80 | ~60 | CLI only | Limited |
| Startup Time | 5 sec | 30-60 sec | 15-30 sec | 3-5 sec | 5-10 sec | 5-10 sec |
| Install Time | 2.5 min | 15-60 min | 15-30 min | 5-15 min | 5-15 min | 3-5 min |
| WP TTFB (cached) | ~2 ms (WP Boost) | 200-600 ms | 150-400 ms | 200-600 ms | 200-500 ms | 100-200 ms |
| SSL Issue Speed | 10-30 sec | 1-4 hours | 30-60 sec | 10-30 sec | 10-30 sec | 10-30 sec |
| Panel Disk | 432 MB | ~1 GB | ~800 MB | ~250 MB | ~150 MB | ~200 MB |
| Architecture | Go (compiled) | Perl+PHP | PHP+JS | C++ | Shell+PHP | Node.js |
| Resource Isolation | 5 layers | 1 (CloudLinux LVE) | None built-in | None | None | None |
| Docker Support | Built-in (160+) | No | Extension | No | No | No |
| PHP Versions | 8.1-8.5 (5) | 5.6-8.3 (EA4) | 7.1-8.3 | Multiple | Multiple | Multiple |
| Theme Presets | 43 | ~5 | ~10 | ~8 | 1 | 1 |
| Languages | 32 | ~18 | ~20 | ~12 | ~30 | ~10 |
| Price (entry) | $0/mo | $15/mo | $10/mo | $2/mo | $0 | $0 |
Panelica default stack: Nginx + MySQL + Redis + BIND + PHP 8.4 + Backend. ClamAV, mail (Postfix/Dovecot), Apache, additional PHP versions, and monitoring tools are available but disabled by default — enable only what you need.
Data Sources & Methodology
- Panelica: Direct measurement on production server (Ubuntu 24.04, 8 cores, 32 GB RAM, NVMe), March 2026
- cPanel: Hostwinds System Requirements, cPanel Blog (Install Times), WebHostingTalk community reports
- Plesk: Plesk Obsidian System Requirements, Plesk Forum
- DirectAdmin: DirectAdmin Documentation, BikeGremlin Review
- WordPress TTFB: HostingStep 2025 Benchmarks
- CloudPanel: CloudPanel.io
- API Response Standards: Odown
Try the Fastest Panel — Free
17 ms API response. 2 ms WordPress cache. 2.5 minute installation. 5-layer isolation. 1,263 endpoints.
Start freeBenchmarks last updated: March 16, 2026. We re-run these tests quarterly. If you have corrections or updated data, contact us.
Thinking about switching from legacy panels?
See how Panelica compares feature-by-feature, including real 2026 pricing and migration steps.
See the full comparison